U.S. Kitchen Incubators: An Appetite for Food-Based Entrepreneurship

Kitchen IncubatorPhoto by Adam Dachis on Unsplash

Economic development organizations seeking to create a more dynamic, entrepreneurial, and inclusive economy would be wise to pay attention to the U.S. kitchen incubator industry.

U.S. kitchen incubators — sometimes characterized as commercially-licensed kitchens, shared-use kitchens, commissary kitchens, kitchen accelerators, or ghost kitchens — are a unique type of culinary micro-enterprise. The terms are used interchangeably, but there are important distinctions between them. The primary distinguishing feature is the degree to which supportive services are provided to wholesale, retail, and catering food entrepreneurs. Shared-use kitchens offer minimal or no support; incubators provide expertise to new and early-stage startups; whereas accelerators look to scale up operations and achieve significant growth for established, investible startups (American Communities Trust, Econsult Solutions, Urbane Development, 2016).

These culinary production facilities are not to be confused with community kitchens, which serve neighborhood stakeholders and institutions, such as St. Mary’s Food Bank Community Kitchen and Local First Arizona Community Kitchen in Phoenix.

Industry surveys indicate that the number of U.S. kitchen incubators grew from no less than 135 in 2013 to more than 200 in 2016, expanding to 600+ across the 48 contiguous states and District of Columbia in 2019 (Econsult Solutions, Urbane Development, The Food Corridor, Catharine Street Consulting, 2020). They operate in urban (52 percent), suburban (27 percent), and rural (21 percent) areas, but are heavily concentrated near large cities (Econsult Solutions et al., 2020). Their popularity stems from the “locavore movement” that connects food producers and consumers within the same geographic region, the creation of food-based makerspace that focuses on handmade products, and a growing recognition that entrepreneurship provides an opportunistic pathway to economic success (The Food Corridor, 2020).

Culinary Entrepreneurship

The relationship between U.S. kitchen incubators, culinary entrepreneurs — chefs, caterers, farmers market and festival vendors, food truck proprietors, bakers, and specialty food producers — and the broader concept of small business entrepreneurship, is powerful.

National Trends

Let’s take a look at the broader picture.

According to the Kauffman Foundation, the rate of new entrepreneurs — or the number of non-business owners that start a new enterprise each month — has fluctuated between 0.27 and 0.34 percent of the adult population during the past two and a half decades. Expressed differently, roughly 300 out of 100,000 adults create a new business.

The rate of new entrepreneurs is highest among Latinos, who have consistently outpaced other races and ethnicities over time. New entrepreneurs who are Asian and White compete closely for second and third position. Comparatively, the rate is slightly lower among African-Americans (see chart below).

Richard Mulligan | The ED Advisor
Source: Kauffman Indicators of Entrepreneurship, Ewing Marion Kauffman Foundation, 2020

Overall, the rate of minority entrepreneurs has increased; while the rate of entrepreneurship among immigrants is significantly higher than for the native-born (see chart below).

Richard Mulligan | The ED Advisor
Source: Kauffman Indicators of Entrepreneurship, Ewing Marion Kauffman Foundation, 2020

This is important because the gap in wealth between immigrants and native-born citizens decreases considerably through business ownership.

Those with the least education have proven themselves to be more prolific when it comes to entrepreneurship in comparison to other groups with higher education attainment levels (see chart below).

Richard Mulligan | The ED Advisor
Source: Kauffman Indicators of Entrepreneurship, Ewing Marion Kauffman Foundation, 2020

Put together, early-stage entrepreneurship is fertile ground for a wide range of ethnic and racial groups looking to grow a business. This is particularly true for U.S. kitchen incubators, where on average, 52 percent of tenants are women and 30 percent are minorities. The diversity of food entrepreneurs is even more prominent in larger metropolitan areas like New York City, San Francisco, Seattle, and Chicago (Econsult Solutions, Urbane Development, The Food Corridor, Catharine Street Consulting, 2020).

U.S. kitchen incubators provide food entrepreneurs with a low-risk opportunity to access their own food production equipment and preparation space — a challenge for startups that is otherwise cost prohibitive. At the same time, entrepreneurs receive training, mentoring, and the opportunity to collaborate with a large network of food companies, while working to refine their business model.

From a “big picture” perspective, kitchen incubators serve as a catalyst for inclusive and equitable economic development.

Business Models

Similar to their tenants, kitchen incubators operate under a diverse set of business models, operating as stand-alone facilities or accessories to markets, community centers, and housing projects, or cloud kitchens. Facility goals are just as diverse, striving to fulfill owner-operated, corporate, non-profit, government, and university-sponsored missions. They can be self-funded, or receive financial support in the form of grants, debt-financing, corporate sponsorship, or investor seed funding. Some are run by culinary entrepreneurs who started their own business and decided to capitalize on the opportunity to lease space and supplement their cash flow. Other facilities are more intentional about supporting entrepreneurs, while providing a living income for their founders. Hence, there is no “standard” kitchen model that can be applied to a region’s culinary ecosystem (Colpaart, 2018).

A key point to remember is that kitchen incubators — like their food business tenants — are startup businesses that need to perform their own due diligence in terms of market research, business model development, financial planning, and marketing. In this regard, it is critically important to customize operations to serve their local communities.

Food Innovation Districts

On a state and regional level, U.S. kitchen incubators are taking root in food innovation districts. A food innovation district is defined as “a geographic concentration of food-oriented businesses, services and community activities that local governments support through planning and economic development initiatives in order to promote a positive business environment, spur regional food system development and increase access to local food,” according to Patty Cantrell of Regional Food Systems Solutions, LLC.

Michigan is a national leader in the establishment of food innovation districts — an outgrowth of the Michigan Good Food Charter, a statewide policy platform that envisions sourcing 20 percent of Michigan’s from Michigan food markets and production, providing 80 percent of the population with access to locally-grown, healthy foods. Several districts have already taken hold in the Eastside Neighborhood, Lansing; Eastern Market, Detroit; Grand Traverse Regional Market, Traverse City; Marquette Food Co-op and Hub, and; Grand Rapids Downtown Market, Grand Rapids.

Food Innovation Districts: An Economic Gardening Tool is designed to help other government and community leaders seize opportunities with local and regional food. Outlined is the process and tools used to create districts, which can be applied elsewhere in the nation. The districts are being put to practical use by fostering regional food hubs, kitchen incubators, farm-to-table retail and restaurants, farmers markets, food festivals, nutrition and cooking education, healthy food assistance, urban agriculture production, and community kitchens.


Culinary Incubator and The Kitchen Door have compiled lists of more than 1,000 kitchens from around the country. Select examples of incubator facilities identified in their respective databases for Greater Phoenix are shown below*:

Chef’s Shared KitchenMesa, AZ
Commissary and Catering KitchenTempe, AZ
Freedom KitchenScottsdale, AZ
NT KitchenPhoenix, AZ
Phoenix Commercial KitchenPhoenix, AZ
Source: CulinaryIncubators.com

National best practices for kitchen incubators include*:

Commonwealth KitchenBoston, MA
Hot Bread KitchenTempe, AZ
Pacific Gateway Center
Culinary Business Incubator
Phoenix, AZ
Source: American Communities Trust, 2016

Phoenix 2025 Food Action Plan

As part of the City of Phoenix General Plan, residents approved a Healthy Food System goal to promote the growth of a healthy, affordable, secure and sustainable food system that makes healthy food available to all Phoenix residents (2015). The 2050 Environmental Sustainability Goals include a Local Food System Goal to maintain a healthy, sustainable, equitable, and thriving local food system (2016).

Incorporated in the Action Plan is a strategy to create a food business rental incubator in the South Central Avenue Corridor, possibly as a food hall. Links to The Shared Kitchen Toolkit: A Practical Guide to Planning, Launching, and Managing a Shared-Use Commercial Kitchen, the Minnesota Institute for Sustainable Agriculture’s Commercial Kitchen Guide, and CulinaryIncubator.com interactive mapping tool are listed as resources under the “Commercial Kitchen” category.

Other resources are identified for community gardens, farm-to-school, farmers markets, food co-ops, food hubs, food waste, healthy living, and urban agriculture.

Included in the Appendix is the South Phoenix Food Action Plan, which taps into the U.S. Environmental Protection Agency’s (EPA) Local Foods, Local Places Program, with management and technical assistance from the U.S. Department of Agriculture, Center for Disease Control and Protection (CDC), and Delta Regional Authority (DRA).

Meanwhile, a development proposal to create a “food innovation center” has surfaced in West Phoenix. Proponents hope to convert an old Kmart building into a center that serves nontraditional food businesses (e.g., food trucks, catering firms, and food delivery businesses). A career training center is also envisioned for the 112,000-square-foot building. Maricopa Community Colleges is conducting a feasibility study for Phoenix’ Community and Economic Development Department.

All of this points to the growing and evolving nature of kitchen incubators, their ability to provide food entrepreneurs with an education in running a business, and a means to provide food industry jobs and education opportunities for those looking to climb the economic ladder.


Editor’s Note: *These are not meant to be all-inclusive lists, but rather a partial sample of kitchen incubator facilities.

Minimum Wage, Minimum Growth

Minimum Wage, Minimum GrowthPhoto by Zhanjiang Chen on Unsplash

Raising the minimum wage leads to slower job and wage growth for younger, low-wage workers

Before the outbreak of the coronavirus pandemic, a host of cities, counties, and states moved to raise the minimum wage. Proponents argued that a higher minimum wage was needed to provide workers with enough income to afford a living wage — the amount required to maintain a normal standard of living. They viewed an increase in the minimum wage as an economic stimulus of sorts, placing more disposable income in the hands of low-income earners. Their hope is that a wage increase would help to lower employee turnover and reduce training costs. Critics claim that a higher minimum wage results in lower employment and reduced hours for existing employees. They believe an increased minimum wage creates a powerful incentive for large employers to automate jobs (witness the kiosks at McDonald’s), while driving companies with low profit margins out of business. Furthermore, they point to a lack of evidence that minimum wages are effective at reducing overall poverty rates or poverty rates among workers.

Amidst this debate, the W. E. Upjohn Institute for Employment Research, a private, not-for-profit, non-partisan, independent research organization that has studied policy-related issues of employment and unemployment since 1945, states that recent working papers indicate “the pass-through effect of minimum wage increases on prices is smaller than previously thought; small raises in the minimum wage lead to slower wage growth for low-wage workers; and that the minimum wage reduces job growth over a period of several years with the effects being strongest for younger workers and for those in industries with a higher proportion of low-wage workers.”

Local and State Minimum Wage Ordinances

Most initiatives to raise the minimum wage are at the local and state level.

Leading the charge is Seattle at $16 per hour for large employers and $15 per hour for small companies. Seattle is joined by Montgomery County, Maryland; New York City; and Washington, D. C., which have established a minimum wage of $15 per hour (effective January 1, 2020). The University of California-Berkeley Labor Center’s Inventory of U.S. City and County Minimum Wage Ordinances reveals that local governments with minimum wage ordinances are highly concentrated in eight blue states — California (36), New Mexico (5), Illinois (2), Maine (2), Maryland (2), Minnesota (2), Colorado (1), Washington (1) — and the District of Columbia.

The Economic Policy Institute Minimum Wage Tracker indicates that 27 states and the District of Columbia have changed their minimum wage law since 2014 (along with their current minimum wage and sub-minimum tipped wage: Alaska ($10.19/$10.19), Arizona ($12.00/$9.00), Arkansas ($10.00/$2.63), California ($13.00/$13.00), Colorado ($12.00/$8.98), Connecticut ($11.00/$6.38), Delaware ($9.25/$2.23), Hawaii ($10.10/$10.10), Illinois ($10.00/$6.00), Maine ($12.00/$6.00), Maryland ($11.00/$3.63), Massachusetts ($12.75/$4.95), Michigan ($9.65/$3.67), Minnesota ($10.00/$10.00), Missouri ($9.45/$4.73), Nebraska ($9.00/$2.13), Nevada ($9.00/$9.00), New Jersey ($11.00/$3.13), New Mexico ($9.00/$2.35), New York ($11.80/$7.85), Oregon ($12.00/$12.00), Rhode Island ($10.50/$3.89), South Dakota ($9.30/$4.65), Vermont ($10.96/$5.48), Washington ($13.50/$13.50), Washington, D. C. ($15.00/$5.00), and West Virginia ($8.75/$2.63).

Seven states have no minimum wage law or have in place a minimum wage below the federal minimum wage of $7.25 per hour — Alabama, Georgia, Louisiana, Mississippi, South Carolina, Tennessee, and Wyoming. The federal minimum wage applies in all of these states.

Cost of living plays an important role in creating industry and region differentials in minimum wage rates. For example, Oregon’s minimum wage law establishes a separate minimum wage rate for the Portland Urban Growth Boundary area and designated non-urban counties. New York law establishes separate minimum wage rates for New York City, suburban counties, and the rest of the state. Simultaneously, New York’s minimum wage law allows for variations by industry. The fast-food industry started at $10.50 in New York City and $9.75 for the rest of the state, both gradually rising to $15 per hour over a period of several years.

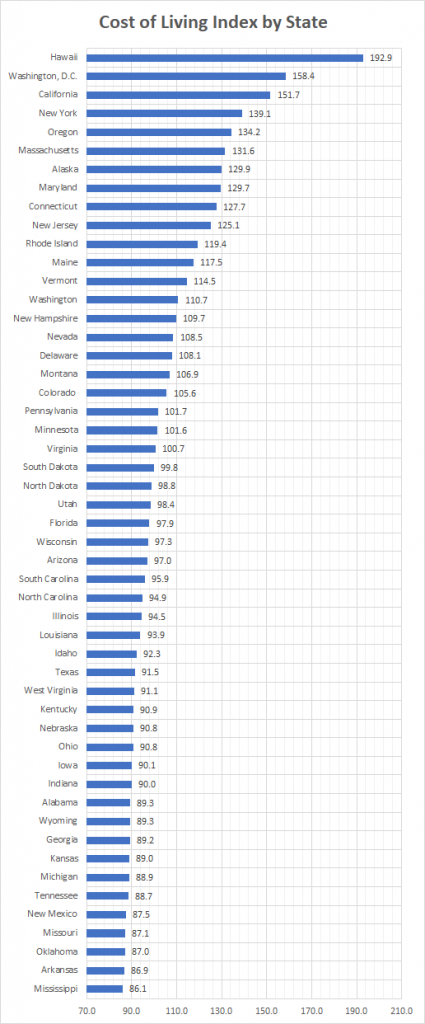
Another common feature is indexing for inflation, which calls for making annual adjustments in the minimum wage based on changes in the Consumer Price Index (states are measured against the national average, which is set at 100). This occurs in eighteen different states and the District of Columbia.

Richard Mulligan | The ED Advisor
Source: World Population Review, 2020

This hodge-podge of higher minimum wages is a reflection of several factors, not least of which are cost of living and political philosophy. It is no coincidence that the highest minimum wages are most often found in jurisdictions with the highest costs for housing, food, healthcare, and other expenses (see chart above). Nor is it a coincidence that the most expensive jurisdictions to live in are Democratic strongholds.

National Minimum Wage

Several groups advocate for raising the national minimum wage to $15 per hour — Campaign for America’s Future, Economic Policy Institute, FairShare, Interfaith Worker Justice, Let Justice Roll Living Wage Campaign, National Employment Law Project, Partnership for Working Families, Reclaim the American Dream, Restaurant Opportunities Centers United, and United for a Fair Economy. These proponents are primarily concerned about providing a living wage for workers, reducing poverty, and wage inequality.

Opposing their efforts are major business organizations such as the National Association of Manufacturers, National Federation of Independent Business, National Restaurant Association, National Retail Federation, and U.S. Chamber of Commerce. They argue that a national minimum wage of $15 per hour leads to increased labor costs and tough choices, causing employers to reduce jobs, reduce hours, or reduce benefits.

Lost in our political discourse are the implications of a one-size-fits all approach that creates unintended consequences for the U.S. and its tapestry of economically diverse states. It’s one thing to implement a $15 minimum wage for low-wage workers in Hawaii, which has a cost of living index of 192.9; another thing entirely to implement a $15 minimum wage in Mississippi, where the cost of living index is 86.1* The impact on lower cost of living states, their industries, and their employees, is broader and far more disruptive.

Weighing in on the discussion is the Congressional Budget Office, which estimates that raising the minimum wage to $15 from its current $7.25 could cost 1.3 million jobs, while increasing wages for 17 million workers.

Despite the state and region differentials in minimum wage, and the prospect of permanent job loss, the Democratic-controlled U.S. House of Representatives passed H. R. 582 – Raise the Wage Act to boost the national minimum wage to $15 per hour in a recorded vote of 231-199. The bill also eliminates the separate minimum wage requirements for disabled, tipped and newly-hired employees (under 20 years of age), bringing them into line with regular employees over a 7-year period. Political observers believe the Senate is unlikely to take up the bill, and President Trump has indicated he’s prepared to veto the legislation.


Minimum wage increases generate mixed outcomes. A higher minimum wage increases worker purchasing power and stimulates consumer demand. On the flip side, a higher minimum wage discourages employers from hiring low-skill, low-wage workers, which leads to slower wage growth — particularly for younger workers — and creates an incentive to replace human labor with automation technology. To a large extent, the gains and losses attributed to a higher minimum wage offset one another.

Perhaps minimum wage federalism offers a better answer.

Why Federalism Matters opens with this statement:

What do we want from federalism?” asked the late Martin Diamond in a famous essay written thirty years ago. His answer was that federalism — a political system that permits a large measure of regional self-rule — presumably gives the rulers and the ruled a “school of their citizenship,” “a preserver of their liberties,” and “a vehicle for flexible response to their problems. These features, broadly construed, are said to reduce conflict between diverse communities, even as a federated polity affords inter-jurisdictional competition that encourages innovations and constrains the overall growth of government” (The Brookings Institution, 2005).

Democrats and other proponents of a higher national minimum wage of $15 per hour are pushing for a level of forced uniformity that ignores the dramatic effects that a “cookie-cutter” minimum wage policy has on employers and workers in different states across the country. As such, state governments and municipalities should be given the flexibility to continue experimenting with their own minimum wage policies. This allows other jurisdictions to learn from their successes and failures.

As an added benefit, decentralizing the minimum wage issue enables the federal government to focus on more important fiscal obligations. For example, COVID-19 has pushed the 2020 National Deficit to $2.74 trillion through June. Second-tier financial issues, like the minimum wage, should be delegated to lower levels of government.

If reducing poverty is the desired policy outcome, there is compelling evidence that the Earned Income Tax Credit (EITC) is a far more effective tool:

Each one percent in a state supplement to the federal EITC reduces poverty rates by one percent. (It also provides an incentive to seek employment, since the credit can only be claimed on earned income)” (Economic Policies Institute, 2020).

Wouldn’t it be nice if the U.S. Congress chose to get the federal government’s fiscal house in order before attempting to dictate to the people about minimum wage policy? Wouldn’t it be nice if the U.S. Congress worked smarter, and not just harder?


*Editor’s Note: A worker earning $15 per hour in Honolulu, Hawaii is equivalent to earning $6 per hour in Hattiesburg, Mississippi, once allowances are made for the difference in cost of living.

The Age-Old Problem

Age DiscriminationPhoto: Getty Images

Age discrimination needs to be a bigger part of the workforce conversation

Amidst a strong economy — before “social distancing” became part of the American lexicon — employers painted a picture of having to scramble to lure applicants. Nearly 7 in 10 employers reported talent shortages, the worst level ever and a jump of 23 percent from the previous year. That’s more than three times higher than a decade ago.

Richard Mulligan | The ED Advisor Source: ManpowerGroup, 2020

While employers struggled to fill positions, ProPublica and the Urban Institute were busy analyzing research data from the Health and Retirement Study (HRS), a premier source of multidisciplinary data that researchers use to address important questions about the challenges and opportunities of aging. They discovered that employers are hesitant to hire or retain older workers, potentially limiting their ability to stick around and retire on their own terms. Those unfortunate enough to be laid off have trouble finding a new job and experience long-term unemployment (ProPublica, 2020).

Between the time older workers enter the study and leave paid employment, 56 percent are displaced before they choose to retire. Only 1 in 10 of these workers ever recovers financially, earning much less than they did before their careers were disrupted. Years afterward, they’re still making up for ground lost and find themselves with fewer job prospects (ProPublica, 2020).

Richard Mulligan | The ED Advisor Source: ProPublica and the Urban Institute

An estimated 28 percent of stable, longtime employees sustain at least one damaging layoff by their employers between turning 50 and leaving work for retirement (ProPublica, 2020).

An additional 13 percent of workers who start their 50s in long-standing positions unexpectedly retire under circumstances that suggest they were encouraged to leave. They begin by telling survey takers they plan to keep working for many years, but, within a couple of years, they suddenly announce they’ve retired, amid a substantial drop in earnings and income (ProPublica, 2020).

So where’s the disconnect?

Age Discrimination

A primary culprit is the age-old problem of discrimination.

According to a 2018 American Association of Retired Persons (AARP) survey, 61 percent of older workers said they had either faced or seen age bias in the workplace; and 38 percent believe the practice is “very common.” A similar 2019 survey sponsored by Hiscox, a global specialist insurer, and conducted by Wakefield Research, found that 80 percent of older workers said their career trajectory had been impacted by their age, and 43 percent had left a company because they had experienced or witnessed age discrimination.

Feeding discriminatory hiring practices is the myth that older workers are somehow “washed up” professionally. Youth-obsessed hiring managers carry negative stereotypes about older workers, who are incorrectly viewed as being set in their ways, are less digitally savvy, are too highly compensated to retain, are complacent or unmotivated, and are difficult to manage.

To make matters worse, hundreds of the nation’s leading employers — Amazon, Cox Communications, Goldman Sachs, T-Mobile, and Facebook, to name a few — were found to have placed recruitment ads that excluded older age groups. They also shut out more experienced job applicants on Linkedin and other social recruting platforms. Such disclosures set off a wave of legal proceedings.

According to several civil rights groups — the American Civil Liberties Union, National Fair Housing Alliance, and Communications Workers of America, among others — some corporate recruitment ads were limited to “digital natives,” “recent college graduates,” or “people younger than 38.” Such hiring tactics are unfair, immoral, and illegal.

As part of a legal settlement with the plaintiffs, Facebook announced it would no longer allow businesses to buy targeted ads that potentially discriminate on the basis of race, gender, or age group. Anyone advertising home sales, employment opportunities, or credit offers — three areas where federal law prohibits discrimination in ads — no longer have the option of explicitly aiming ads at people on the basis of those characteristics. This policy change also applies to advertising on Instagram and Messenger, which are Facebook subsidiaries.

Despite this progress, age discrimination is an accepted bias that continues to pervade the hiring process in many organizations.

America’s Aging Demographics

Ironically, the discussion about age discrimination comes at a time when America’s population is growing older.

By 2060, the elderly share of the U.S. population (65 and older), which was 15.2 percent as recently as 2016, is expected to climb to 23.4 percent — an increase of 8.2 percent. Small percentage declines are predicted for the remaining cohorts: -2.1 percent (ages 45-64); -3.1 percent (ages 18-44); and -3.0 percent (under 18).

Compared to the younger population, the 65-plus crowd is the fastest growing segment of the American workforce.

Richard Mulligan | The ED Advisor Source: U.S. Census Bureau, 2020

Many people believe there is a strong correlation between America’s aging population and the Baby Boomer generation. That’s understandable, but inaccurate. Falling fertility rates and increases in life expectancy are the driving forces behind these demographic trends. This would have occurred even if the Baby Boom had never taken place. Baby Boomers have influenced the timing of America’s aging — at first, dampening its effect, but on the back end, accelerating it (Concord Coalition and Global Aging Institute, 2020).

Protecting Older Workers Against Discrimination Act (POWADA)

In January, the U.S. House of Representatives voted 261-155 in favor of H.R. 1230, the Protecting Older Workers Against Discrimination Act (POWADA). Sponsored by Representatives Bobby Scott (D-VA) and Jim Sensenbrenner (R-WI), the legislation would restore protections lost in a 2009 U.S. Supreme Court decision that required age to be the sole reason an employer fired or changed a worker’s job in order for the worker to win an age discrimination case.

The legislative process now shifts to the U.S. Senate, where bipartisan companion legislation (S. 485) is sponsored by Senators Chuck Grassley (R-IA) and Bob Casey (D-PA).

Our nation’s premier 50+ organizations — American Association of Retired Persons (AARP) and Association of Mature American Citizens (AMAC) — have thrown their support behind this legislation.

Unfortunately, age discrimination in the workplace is still disturbingly pervasive. Too many companies don’t seem to understand and appreciate the value of older employees. The positive qualities attributed to them — experience, perspective, adaptability, responsibility, commitment — can be tapped in many different ways. Measures such as the POWADA legislation are a step in the right direction toward eliminating discrimination and providing better access to quality jobs for older workers.


Countless workers in their 50s, 60s, 70s and beyond are actively engaged in their careers and enjoy working. Some are impacted by financial pressures caused by the COVID-19 lockdowns or Great Recession; some are caregivers for parents who live longer; others find meaning and self-fulfillment, or work to maintain their emotional well-being.

At 93, Tony Bennett, America’s iconic singer of traditional pop, big band, show tunes, and jazz music, has eleven concerts remaining on his 2020 tour. Franklin Graham, age 67, leads religious crusades and provides political commentary, all the while serving as CEO of the Billy Graham Evangelistic Association and Samaritan’s Purse, an international Christian relief organization. At 85, David McCullough, one of our country’s most beloved historians, known for his Pulitzer Prize-winning biographies of Harry Truman and John Adams, published his 13th book, “The Pioneers: The Heroic Story of the Settlers Who Brought the American Ideal West.” Nancy Pelosi, the 60th and 63rd Speaker of the U.S. House of Representatives, is 80 years old. Next year, the White House is slated to be occupied by one of two candidates who are working well beyond the age that most people start collecting Social Security. The incumbent, President Donald Trump, is nearly 74 years old. His challenger, former Vice President Joe Biden, will turn 78 less than three weeks after the 2020 Presidential Election.

Like many of today’s older workers, these prominent citizens are skilled, proficient, and have a strong work ethic. This leads to a priceless gift — the joy of work.

###

Business Retention and Expansion

Business Retention and ExpansionPhoto by 123RF

Economist Joseph Schumpeter (1883-1950) is best known for his economic theories on business cycles, capitalism, and for introducing the concept of entrepreneurship. In Capitalism, Socialism, and Democracy (1942), Schumpeter coins the term “creative destruction,” which describes the “process of industrial mutation that continuously revolutionizes the economic structure from within, incessantly destroying the old one, incessantly creating a new one.” The term easily applies to economic development organizations (EDOs) and their approach to business retention and expansion.

Where Are Jobs Being Created?

Economic development leaders understand the importance of new and existing businesses. They are keenly interested in existing companies, which create 75 percent of new private-sector jobs. They are also attentive to the 25 percent of new private-sector jobs that come from the churn of new startups minus business closures (U.S. Bureau of Labor Statistics, 2020).

Employment From Establishment Dynamics, 2010-2018
Richard Mulligan | The ED Advisor Employment From Establishment Dynamics, 2010-20218

Click on graphic to enlarge

EDO concerns about existing businesses and employment are reflected in the implementation of business retention and expansion programs. Business Retention & Expansion International, in partnership with Eric Canada, CEO, Blane, Canada, Ltd., offer the following definition for such activities:

“In economic development, business retention and expansion is a program designed to strengthen the connection between companies and the community while encouraging each business to continue to grow in the community. Through direct interactions, events, and research, the program seeks to gain insight into business practices, planned future actions, as well as the challenge of targeted companies. Then, to turn this ‘business intelligence’ into value added services, programs, and/or products that address individual and shared company opportunities and problems” (2018).

Properly executed, business retention and expansion programs cultivate a strong business climate and create satisfied CEOs that become effective cheerleaders and tireless goodwill ambassadors for the community. At the same time, business prospects evaluate the community’s economic suitability and receptivity for business through conversations with these same CEOs.

The business retention and expansion toolbox includes business surveys, business walks, industry roundtables and focus groups, and other activities. The level of community engagement adopted by EDOs is a reflection of their social, economic, and cultural environment.

Business Surveys

One technique for soliciting feedback about a community’s business climate is the implementation of business surveys. This requires EDOs to build a database of existing businesses and determine the types of businesses that will be approached (e.g., high-wage firms, firms in select geographic areas, or firms in targeted industry clusters). Hard copies of the surveys are mailed to local businesses and recipients are given two options to provide feedback — online through a SurveyMonkey link or completion of a printed copy of the survey. The information collected protects the confidentiality of respondents and the survey results are reported in the aggregate, helping EDOs to better serve the needs of existing employers.

Business Visitations

Complementing business surveys are volunteer- and economic developer-led business visitations. Visits are focused on interviews with C-level executives to learn how the community might help their company. The interview solicits information about the firm’s plans for expansion or relocation, which is helpful in identifying growth opportunities and at-risk companies. Follow-up is critical and can take the form of a letter or phone call that responds to issues raised during the interview.

Capturing and analyzing the data obtained from business surveys and visitations is an important component of business retention and expansion programs. A variety of software packages are available to help manage survey data and provide insights into local businesses and their economic potential, including:

Bludot

Bludot offers modern, cloud-based software that allows users to view and manage all businesses in the community with one platform. A relatively new product on the market, Bludot is now live at 14 cities located in California, Florida, and Maryland. Bludot recently offered 3 months free usage of their software for any cities that want to support and engage with their businesses during the COVID-19 pandemic. The firm has received funding from the Alchemist Accelerator and GovTech Fund, is a startup partner with City Innovate, and a member of Stanford StartX.

ExecutivePulse

ExecutivePulse is promoted as a Customer Relationship Management (CRM) solution for economic developers, public-sector agencies, and community stakeholders. The product can be used for business recruitment, foreign-direct investment, business retention and expansion, entrepreneurial development, workforce development, and related initiatives. Recent case studies listed on the firm’s website include the Province of Albert, Canada; Birmingham Business Alliance; British Columbia Economic Development Association; Fresno County Economic Development Corporation; Philadelphia Works; Cornerstone Alliance (Southwest Michigan); Province of Ontario, Canada; Commonwealth of Pennsylvania; and San Bernardino County, California.

Gazelle.ai

Gazelle.ai is an “AI-Powered Business Intelligence Growth Platform” designed to identify fast-growth companies for business development. Extremely useful for business attraction and recruitment, the platform also has the ability to identify growth companies in the EDOs own backyard. Client resources include articles, infographics, press releases, podcasts, and webinars.

Synchronist Suite

Developed almost 20 years ago, Synchronist Suite is the granddaddy of crowdsourced economic development software. The platform revolves around business interviews, interview validation, objective analysis, predictive analysis, and key performance indicators. Synchronist provides insight into customer relationship management; each company’s value, growth potential, level of risk, and satisfaction; quality of a market’s retail, education, health care, arts/culture, and other local services; talent development; project tracking; research; and training. The “Synchronist User’s Forum” is held annually to network, share best practices, conduct how-to sessions, and discuss ongoing research projects.

Business Walks

Business walks provide a day dedicated to learning more about local businesses through face-to-face interviews on the business’ turf. They allow teams of community leaders to canvass multiple businesses in one day, covering more ground than traditional business visitations. The teams utilize short, streamlined surveys of predetermined questions to identify issues and bring resources to bear on those issues, and to diagnose firms on the brink of expansion or those at risk. Successful business walks are held in communities throughout the United States and Canada.

Regardless of technique, business retention and expansion programs work best when integrated into the EDOs economic development strategy, business attraction and recruitment, and entrepreneurial development initiatives.

Industry Roundtables and Focus Groups

Anatalio Ubalde, CEO, SizeUp and GIS Planning Inc., has written a thought-provoking article that identifies 10 business retention and expansion innovation trends. He considers industry roundtables and focus groups a superior method of collaborative problem solving. He makes the argument that “the business survey should die,” and outlines their shortcomings when it comes to dealing with the “acting as fast as business” expectations of modern companies. In his opinion, business surveys are not agile enough to anticipate fundamental marketplace shifts.

“The business survey should die.”

Anatalio Ubalde, CEO, SizeUp and GIS Planning Inc.

Business walks help to expand the retention and expansion footprint, but require that EDOs follow up quickly to address the issues raised by businesses. If EDOs are incapable of responding quickly, Anatalio believes they are better off not proceeding with a business walk.

Deliver Direct Value

Ubalde finds there is an inherent conflict between EDO job creation metrics, businesses that are focused on increasing productivity and reducing labor costs with technology, and workforce development. Going forward, the focus of business retention and expansion needs to change. If EDO and local business meetings are to be successful, economic developers have to deliver direct value to local businesses. Delivering direct value means viewing business relationships as a two-way street. Instead of gathering business intelligence and responding in-kind, Ubalde contends that EDOs should use Internet-delivered technology to proactively deliver assistance to a broader constituency of local businesses. This takes the form of data and information that helps them better understand company performance, find customers, and improve operations.


A market-driven economy is going to produce a certain amount of “churn” or “creative destruction” over time. In fact, strong economies are characterized by high rates of churn and high rates of economic growth. The challenge for economic development professionals is determining how to help businesses survive and grow in the midst of inevitable change, while mining business intelligence data.


Editor’s Note: “Beyond the Survey: How EDOs Add Value Through Business Retention and Expansion” explains how EDOs are moving from basic survey and visitation models to more comprehensive, value-added models. The paper outlines the various ways EDOs are serving businesses, measuring their activities, and promoting them in the community.

###

The Unsung Progress of Women

The Unsung Progress of WomenPhoto by Jungwoo Hong on Unsplash

The title on her Facebook page reads: “Sara Fried Fitness.” A static banner at the top of the page displays this header: “Sharing My Life * Monthly Online Fitness Groups * Ongoing Personal New Coach Mentorship.” Below is the tagline: “WIFE. Physical therapist turned SAHM to two boys. Fashion lover.” Website visitors are invited to text with questions about fitness, nutrition, or personal development. In a recent post, she laments the impact of a car accident that left her with a herniated disc. She refers to physical therapy as “a career I love…& I mean LOVE,” noting that “Coaching has given me choices. And while I’m going to stay in physical therapy as long as I can, it’s nice to know I have options.” Sara’s social media platform is a living testimony to the unsung progress of women.

Education Gender Gap

She also happens to be my daughter.

Sara is a graduate of Northern Arizona University (NAU), where she earned a Bachelor of Science in Exercise Science. She, along with other female students of the millennial generation (and beyond), make up a majority of full- and part-time students attending U.S. colleges and universities. It’s been this way for quite some time. One has to take a step back in time — 1978 to be precise — to find enrollment records where male students outnumber their female counterparts in postsecondary education. The gender gap has widened considerably in the last four decades.

Richard Mulligan | The ED Advisor Source: National Center for Education Statistics

Click on graphic to enlarge

Education and Earnings

The strong correlation between education, income, and wealth is common knowledge. What is not well known is the extent to which women have leveraged their education to increase their paychecks. Reports show that increases in earnings have favored women over men for decades.

Richard Mulligan | The ED Advisor Source: U.S. Bureau of Labor Statistics, Current Population Survey

Click on graphic to enlarge

On the lower end of the education attainment spectrum, both men and women have experienced declines in weekly earnings. However, the decrease for women was much smaller than for men — a drop of 5 percent for women, compared to a decline of 26 percent for men.

Men with moderate education attainment levels have experienced a decline in weekly earnings of 18 and 11 percent, respectively. At the same time, women with equivalent levels of education increased their earnings by 3 and 5 percent.

Earnings for women with a bachelor’s degree or higher increased 34 percent, while earnings for men rose by 19 percent.

Herein lies the primary evidence for the unsung progress of women.

There is No Gender Wage Gap

“Equal Pay Day” was originated by the National Committee on Pay Equity (NCPE) in 1996. The symbolic day serves as a public relations event to illustrate the pretense of a gender pay gap.

Democratic leaders — President Barack Obama, Hillary Clinton, and others — have mimicked the NCPE’s contention that “In 2018, the median salaries for all full-time, year-round workers showed women earning 81.6 cents for every dollar men earned.” Outlets as politically diverse as HuffPost, Prager University and The Washington Post have explained this statistic and why it is misleading.

The gender gap statistic cites only the average difference between men and women, across all jobs, making no mention of occupation, position, education, number of hours worked, time taken off, or most significantly, the impact of personal life choices. A study by the American Association of University Women (AAUW), a well-known feminist organization, looked at male and female college graduates one year after graduation, and found that when you control for the differences in choice between men and women, the wage gap narrowed to only 6.6 percent.

Choice is the operative word.

Far fewer women choose to work in construction, production, transportation, and material moving occupations, preferring to enter career fields that pay less than those chosen by men. On the other hand, more women choose to occupy a higher percentage of professional and related occupations than men.

Richard Mulligan | The ED Advisor Source: U.S. Bureau of Labor Statistics, Current Population Survey

Click on graphic to enlarge

Impacting women’s decision-making processes is their personal preference for jobs with lower pay but greater benefits (time off to raise children), less physical risk, and more stable work hours.

Those asserting that the gender gap is a product of discrimination against women have invested in faulty logic. Using the same reasoning, young men are being discriminated against by young women. After all, twenty-something females have earnings that exceed men’s income by 10 percent or more, at least in certain disciplines. It must also be true that white men are being discriminated against by Asian-American men, who outearn their caucasian brethren by over 5 percent. Silly, right? Such flawed thinking is ridiculous at face value, which drives home the point.

Epilogue

If you compare men and women who hold the same job, with similar backgrounds and qualifications, the wage gap is virtually nonexistent. This runs counter to our political discourse, much of which is firmly entrenched in 1970s-era feminism. Claims that women are being paid less, and this is key — for doing the same work as men — doesn’t hold up to tighter scrutiny. Fact checkers have consistently rated such claims as “mostly false.” Unfortunately, that hasn’t stopped politicians and well-intentioned advocates from portraying women as chronic and perpetual victims of discrimination.

This does a disservice to the millions of women who, like my daughter, earned a college degree, pursued their passion, built a career, and made tremendous economic strides. They are making personal career and life choices — often in collaboration with their husband, partner, or significant other — to achieve positive outcomes for themselves, their families, and the communities where they live.

Let’s celebrate the unsung progress of women.


Editor’s Note: A report from the U.S. Census Bureau, “The Changing Economics and Demographics of Young Adulthood: 1975 – 2016,” reveals that young women are pulling ahead of many young men in the workforce. At the same time, young men are falling to the bottom of the income ladder, a trend we will explore in a future blog post.

###

Social Entrepreneurship for Persons with Disabilities

Social EntrepreneurshipPhoto by Ian Schneider on Unsplash

Social entrepreneurship is on the rise.

Conventional wisdom tells us there is a big distinction between for-profit businesses and non-profit organizations. Businesses are laser-like focused on their market-driven business model; nonprofits strive to fulfill a charitable mission that advances the public interest. As the old saying goes, “never the twain shall meet.”

This traditional way of thinking is giving way to the notion that businesses can pursue profits and address key social and environmental issues. Likewise, nonprofits can stay on mission and generate a profitable revenue stream. Both concepts are essential components of an alternate business model — the social enterprise.

Properly executed, social enterprises are uniquely positioned as change agents for addressing a particular social problem. Social entrepreneurship is spreading across a wide range of industries and pursuing altruistic goals — not the least of which is giving persons with disabilities a lift up.

Motivating Factors

What is the motivation for pursuing social entrepreneurship and the desire to operate social enterprises for persons with disabilities?

A primary consideration is the economic divide that exists between persons with and without disabilities. The 2019 Annual Report on People with Disabilities in America, published by the Institute on Disability/UCED, University of New Hampshire, outlines the scope of their social and economic status:

Population

There are 42.6 million people with disabilities, who comprise 13.1 percent of the U.S. population. Disabilities refers to difficulties related to vision, hearing, cognition, ambulation, self-care, and independent living. The percentage of the population with disabilities has trended upward during the past decade, increasing from 12.7 percent in 2008 to 13.1 percent in 2018.

Education

Approximately 16.7 percent of persons with disabilities have not attained a high school diploma, compared to 7.7 percent of their peers without disabilities, reflecting a 9.0 percentage gap.

With regard to the gap between people with and without disabilities at the postsecondary level, 15.6 percent of persons with disabilities attained a bachelor’s degree or higher, compared to 38.4 percent of those without disabilities. This reflects a college-or-more gap of 22.8 percent.

Employment

About 37.5 percent of people with disabilities are employed on a full-time basis. In contrast, the employment percentage was more than double for people without disabilities at 77.8 percent. The employment gap is 40.3 percent.

Earnings From Work

The median earnings of full-time/full-year workers with disabilities was $40,454, compared to $46,250 of workers without disabilities, resulting in an earnings gap of $5,796.

Poverty

Earnings from work and personal income are indicators of a person’s financial condition. At the same time, poverty is measured at the family level. An individual is considered to be living in poverty if they live in a family with income below the poverty line — a figure that varies depending on the makeup of their family. In 2018, the poverty rate for people with disabilities was 26.9 percent, compared to 12.2 percent for people without disabilities.

Statistics don’t tell the whole story.

Parental caregivers worry about what happens to their developmentally disabled children when they grow up. As the statistics on disabilities have shown, their chances of obtaining employment, decent living arrangements, or achieving financial independence are significantly compromised. Government assistance and nonprofit agencies are helpful, but their resources are insufficient when it comes to overcoming the barriers that persons with disabilities face in society. A different model is needed that rises to the occasion.

Necessity Becomes the Mother of Invention

Parents and primary caregivers are taking matters into their own hands. They are starting businesses and nonprofit charities so their adult child can know independence and achieve a greater sense of belonging.

Outlined below are several examples of a larger growing trend — social enterprises that embrace the concepts of social entrepreneurship and inclusivity, and have a passion for working with developmentally disabled people.

First Place®

Aspiring to serve as a catalyst for international models, First Place® provides a supportive housing and residential transition program for individuals with autism and people with other disabilities. Folded into their program are sites for education, training, and creative inspiration.

First Place-Phoenix, the 501(c)(3) nonprofit charitable organization’s first new property, leases 55 apartments where residents are supported by a suite of resources and amenities that are designed to maximize independence, community integration, personal enrichment, and quality of life.

The Southwest Autism Research & Resource Center operates the two-year, tuition-based First Place Transition Academy, building crucial independent living and career-readiness skills for 32 participants each year.

First Place Global Leadership Institute works toward increasing the number of housing options available to persons with disabilities. The Institute collaborates with educators and medical professionals, focuses on autism research, and develops leadership skills and competencies to advance promising best practices.

Luna Azul

Located in Phoenix, Arizona, Luna Azul is the first for sale residential community in the nation that is specifically designed for adults with disabilities. This one-of-a-kind community consists of 30 single-family, cottage-style residences in a planned “pocket neighborhood” of smart homes. A partnership with Partners4Housing provides an online matching platform to help people move into independent housing. The homeowner’s association employs a full-time, on-site director and overnight staff to promote community engagement, safety, and peace of mind for the resident population and their caregiving families.

Not Your Typical Deli

Not Your Typical Deli is a full-service delicatessen and bakery, located in Gilbert, Arizona. It was created with a special purpose in mind — not only do they serve award-winning food, they also provide an integrated work environment for those with developmental disabilities. On average, 60 to 70 percent of their workforce is made up of adults with autism and/or other developmental challenges.

NYT Deli serves as a job-training site, offering three 12-week training programs per year for adults with developmental disabilities. Because of its popularity, the restaurant has a huge backlog of applicants to work at the deli. Rather than expand the deli, the owners created the Not Your Typical Culinary Academy to prepare students for employment in the restaurant or hospitality industry.

Spencer’s Place

Spencer’s Place is a coffee shop and bistro in Surprise, Arizona. The small business employs individuals with cognitive and developmental disabilities. Per their website, these individuals are able to “earn a paycheck, build relationships, gain a sense of purpose, and show the community the beauty of diversity and inclusion.” Spencer’s Place was created in partnership with the Employed and Overjoyed Foundation to promote equal employment opportunities for persons with disabilities.

Social entrepreneurship is the driving force for innovative business solutions that create employment opportunities and supportive housing for people with disabilities. That mindset is channeled through social enterprises that have a double bottom line of profit/loss and social impact.


Editor’s Note: The Case for Inclusion Report 2019, a publication of United Cerebral Palsy and the ANCOR Foundation, ranked Arizona #1 in their state rankings for performance in serving individuals with intellectual and developmental disabilities.