
Economic development organizations seeking to create a more dynamic, entrepreneurial, and inclusive economy would be wise to pay attention to the U.S. kitchen incubator industry.
U.S. kitchen incubators — sometimes characterized as commercially-licensed kitchens, shared-use kitchens, commissary kitchens, kitchen accelerators, or ghost kitchens — are a unique type of culinary micro-enterprise. The terms are used interchangeably, but there are important distinctions between them. The primary distinguishing feature is the degree to which supportive services are provided to wholesale, retail, and catering food entrepreneurs. Shared-use kitchens offer minimal or no support; incubators provide expertise to new and early-stage startups; whereas accelerators look to scale up operations and achieve significant growth for established, investible startups (American Communities Trust, Econsult Solutions, Urbane Development, 2016).
These culinary production facilities are not to be confused with community kitchens, which serve neighborhood stakeholders and institutions, such as St. Mary’s Food Bank Community Kitchen and Local First Arizona Community Kitchen in Phoenix.
Industry surveys indicate that the number of U.S. kitchen incubators grew from no less than 135 in 2013 to more than 200 in 2016, expanding to 600+ across the 48 contiguous states and District of Columbia in 2019 (Econsult Solutions, Urbane Development, The Food Corridor, Catharine Street Consulting, 2020). They operate in urban (52 percent), suburban (27 percent), and rural (21 percent) areas, but are heavily concentrated near large cities (Econsult Solutions et al., 2020). Their popularity stems from the “locavore movement” that connects food producers and consumers within the same geographic region, the creation of food-based makerspace that focuses on handmade products, and a growing recognition that entrepreneurship provides an opportunistic pathway to economic success (The Food Corridor, 2020).
Culinary Entrepreneurship
The relationship between U.S. kitchen incubators, culinary entrepreneurs — chefs, caterers, farmers market and festival vendors, food truck proprietors, bakers, and specialty food producers — and the broader concept of small business entrepreneurship, is powerful.
National Trends
Let’s take a look at the broader picture.
According to the Kauffman Foundation, the rate of new entrepreneurs — or the number of non-business owners that start a new enterprise each month — has fluctuated between 0.27 and 0.34 percent of the adult population during the past two and a half decades. Expressed differently, roughly 300 out of 100,000 adults create a new business.
The rate of new entrepreneurs is highest among Latinos, who have consistently outpaced other races and ethnicities over time. New entrepreneurs who are Asian and White compete closely for second and third position. Comparatively, the rate is slightly lower among African-Americans (see chart below).
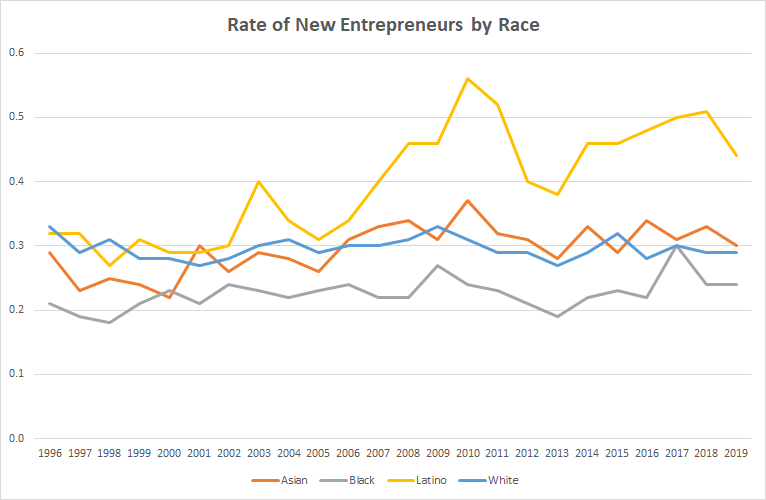
Source: Kauffman Indicators of Entrepreneurship, Ewing Marion Kauffman Foundation, 2020
Overall, the rate of minority entrepreneurs has increased; while the rate of entrepreneurship among immigrants is significantly higher than for the native-born (see chart below).
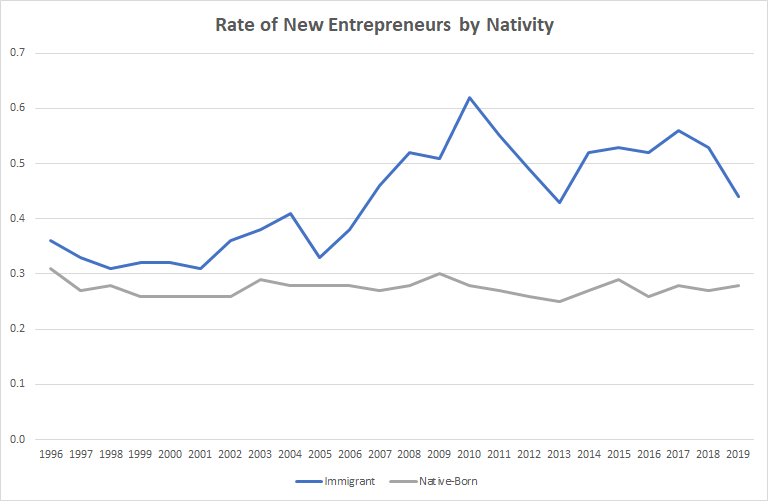
Source: Kauffman Indicators of Entrepreneurship, Ewing Marion Kauffman Foundation, 2020
This is important because the gap in wealth between immigrants and native-born citizens decreases considerably through business ownership.
Those with the least education have proven themselves to be more prolific when it comes to entrepreneurship in comparison to other groups with higher education attainment levels (see chart below).
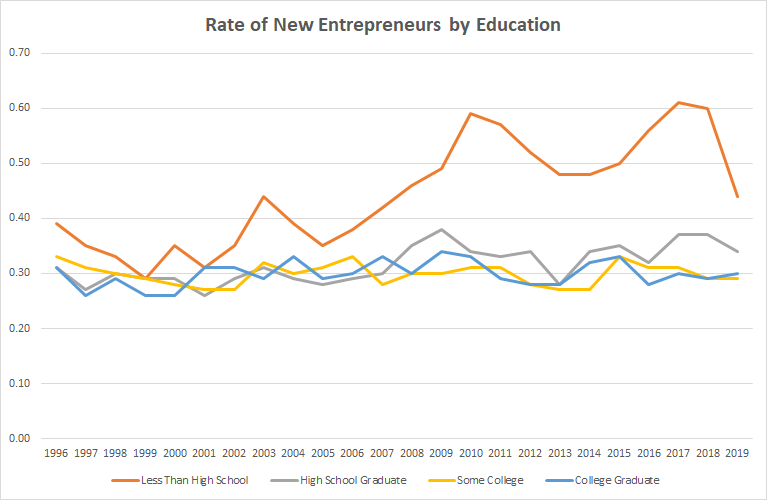
Source: Kauffman Indicators of Entrepreneurship, Ewing Marion Kauffman Foundation, 2020
Put together, early-stage entrepreneurship is fertile ground for a wide range of ethnic and racial groups looking to grow a business. This is particularly true for U.S. kitchen incubators, where on average, 52 percent of tenants are women and 30 percent are minorities. The diversity of food entrepreneurs is even more prominent in larger metropolitan areas like New York City, San Francisco, Seattle, and Chicago (Econsult Solutions, Urbane Development, The Food Corridor, Catharine Street Consulting, 2020).
U.S. kitchen incubators provide food entrepreneurs with a low-risk opportunity to access their own food production equipment and preparation space — a challenge for startups that is otherwise cost prohibitive. At the same time, entrepreneurs receive training, mentoring, and the opportunity to collaborate with a large network of food companies, while working to refine their business model.
From a “big picture” perspective, kitchen incubators serve as a catalyst for inclusive and equitable economic development.
Business Models
Similar to their tenants, kitchen incubators operate under a diverse set of business models, operating as stand-alone facilities or accessories to markets, community centers, and housing projects, or cloud kitchens. Facility goals are just as diverse, striving to fulfill owner-operated, corporate, non-profit, government, and university-sponsored missions. They can be self-funded, or receive financial support in the form of grants, debt-financing, corporate sponsorship, or investor seed funding. Some are run by culinary entrepreneurs who started their own business and decided to capitalize on the opportunity to lease space and supplement their cash flow. Other facilities are more intentional about supporting entrepreneurs, while providing a living income for their founders. Hence, there is no “standard” kitchen model that can be applied to a region’s culinary ecosystem (Colpaart, 2018).
A key point to remember is that kitchen incubators — like their food business tenants — are startup businesses that need to perform their own due diligence in terms of market research, business model development, financial planning, and marketing. In this regard, it is critically important to customize operations to serve their local communities.
Food Innovation Districts
On a state and regional level, U.S. kitchen incubators are taking root in food innovation districts. A food innovation district is defined as “a geographic concentration of food-oriented businesses, services and community activities that local governments support through planning and economic development initiatives in order to promote a positive business environment, spur regional food system development and increase access to local food,” according to Patty Cantrell of Regional Food Systems Solutions, LLC.
Michigan is a national leader in the establishment of food innovation districts — an outgrowth of the Michigan Good Food Charter, a statewide policy platform that envisions sourcing 20 percent of Michigan’s from Michigan food markets and production, providing 80 percent of the population with access to locally-grown, healthy foods. Several districts have already taken hold in the Eastside Neighborhood, Lansing; Eastern Market, Detroit; Grand Traverse Regional Market, Traverse City; Marquette Food Co-op and Hub, and; Grand Rapids Downtown Market, Grand Rapids.
Food Innovation Districts: An Economic Gardening Tool is designed to help other government and community leaders seize opportunities with local and regional food. Outlined is the process and tools used to create districts, which can be applied elsewhere in the nation. The districts are being put to practical use by fostering regional food hubs, kitchen incubators, farm-to-table retail and restaurants, farmers markets, food festivals, nutrition and cooking education, healthy food assistance, urban agriculture production, and community kitchens.
Culinary Incubator and The Kitchen Door have compiled lists of more than 1,000 kitchens from around the country. Select examples of incubator facilities identified in their respective databases for Greater Phoenix are shown below*:
| Chef’s Shared Kitchen | Mesa, AZ |
| Commissary and Catering Kitchen | Tempe, AZ |
| Freedom Kitchen | Scottsdale, AZ |
| NT Kitchen | Phoenix, AZ |
| Phoenix Commercial Kitchen | Phoenix, AZ |
National best practices for kitchen incubators include*:
| Commonwealth Kitchen | Boston, MA |
| Hot Bread Kitchen | Tempe, AZ |
| Pacific Gateway Center Culinary Business Incubator | Phoenix, AZ |
Phoenix 2025 Food Action Plan
As part of the City of Phoenix General Plan, residents approved a Healthy Food System goal to promote the growth of a healthy, affordable, secure and sustainable food system that makes healthy food available to all Phoenix residents (2015). The 2050 Environmental Sustainability Goals include a Local Food System Goal to maintain a healthy, sustainable, equitable, and thriving local food system (2016).
Incorporated in the Action Plan is a strategy to create a food business rental incubator in the South Central Avenue Corridor, possibly as a food hall. Links to The Shared Kitchen Toolkit: A Practical Guide to Planning, Launching, and Managing a Shared-Use Commercial Kitchen, the Minnesota Institute for Sustainable Agriculture’s Commercial Kitchen Guide, and CulinaryIncubator.com interactive mapping tool are listed as resources under the “Commercial Kitchen” category.
Other resources are identified for community gardens, farm-to-school, farmers markets, food co-ops, food hubs, food waste, healthy living, and urban agriculture.
Included in the Appendix is the South Phoenix Food Action Plan, which taps into the U.S. Environmental Protection Agency’s (EPA) Local Foods, Local Places Program, with management and technical assistance from the U.S. Department of Agriculture, Center for Disease Control and Protection (CDC), and Delta Regional Authority (DRA).
Meanwhile, a development proposal to create a “food innovation center” has surfaced in West Phoenix. Proponents hope to convert an old Kmart building into a center that serves nontraditional food businesses (e.g., food trucks, catering firms, and food delivery businesses). A career training center is also envisioned for the 112,000-square-foot building. Maricopa Community Colleges is conducting a feasibility study for Phoenix’ Community and Economic Development Department.
All of this points to the growing and evolving nature of kitchen incubators, their ability to provide food entrepreneurs with an education in running a business, and a means to provide food industry jobs and education opportunities for those looking to climb the economic ladder.
Editor’s Note: *These are not meant to be all-inclusive lists, but rather a partial sample of kitchen incubator facilities.